Advertising Campaing Dashboard

Data Scientist skilled in Python, SQL, Pandas, Plotly, Excel and Power BI @HaroldRojas

Design a pipeline to gather and process COVID-19 data using AWS Glue Crawler and Athena, in construction...

Transform raw housing data into a usable format for analysis by cleaning with SQL Server

I emerged victorious in the #100daysofpython challenge organized by the Python La Paz-Bolivia community, clinching the top score without a single day missed and being honored as the first-place winner.

In this project, we delve into global COVID-19 data analysis using SQL Server as our tool of choice. To uncover valuable insights, we apply various techniques, including table joins, common table expressions (CTEs), temporary tables, windows functions, aggregate functions, view creation, and data type conversion.

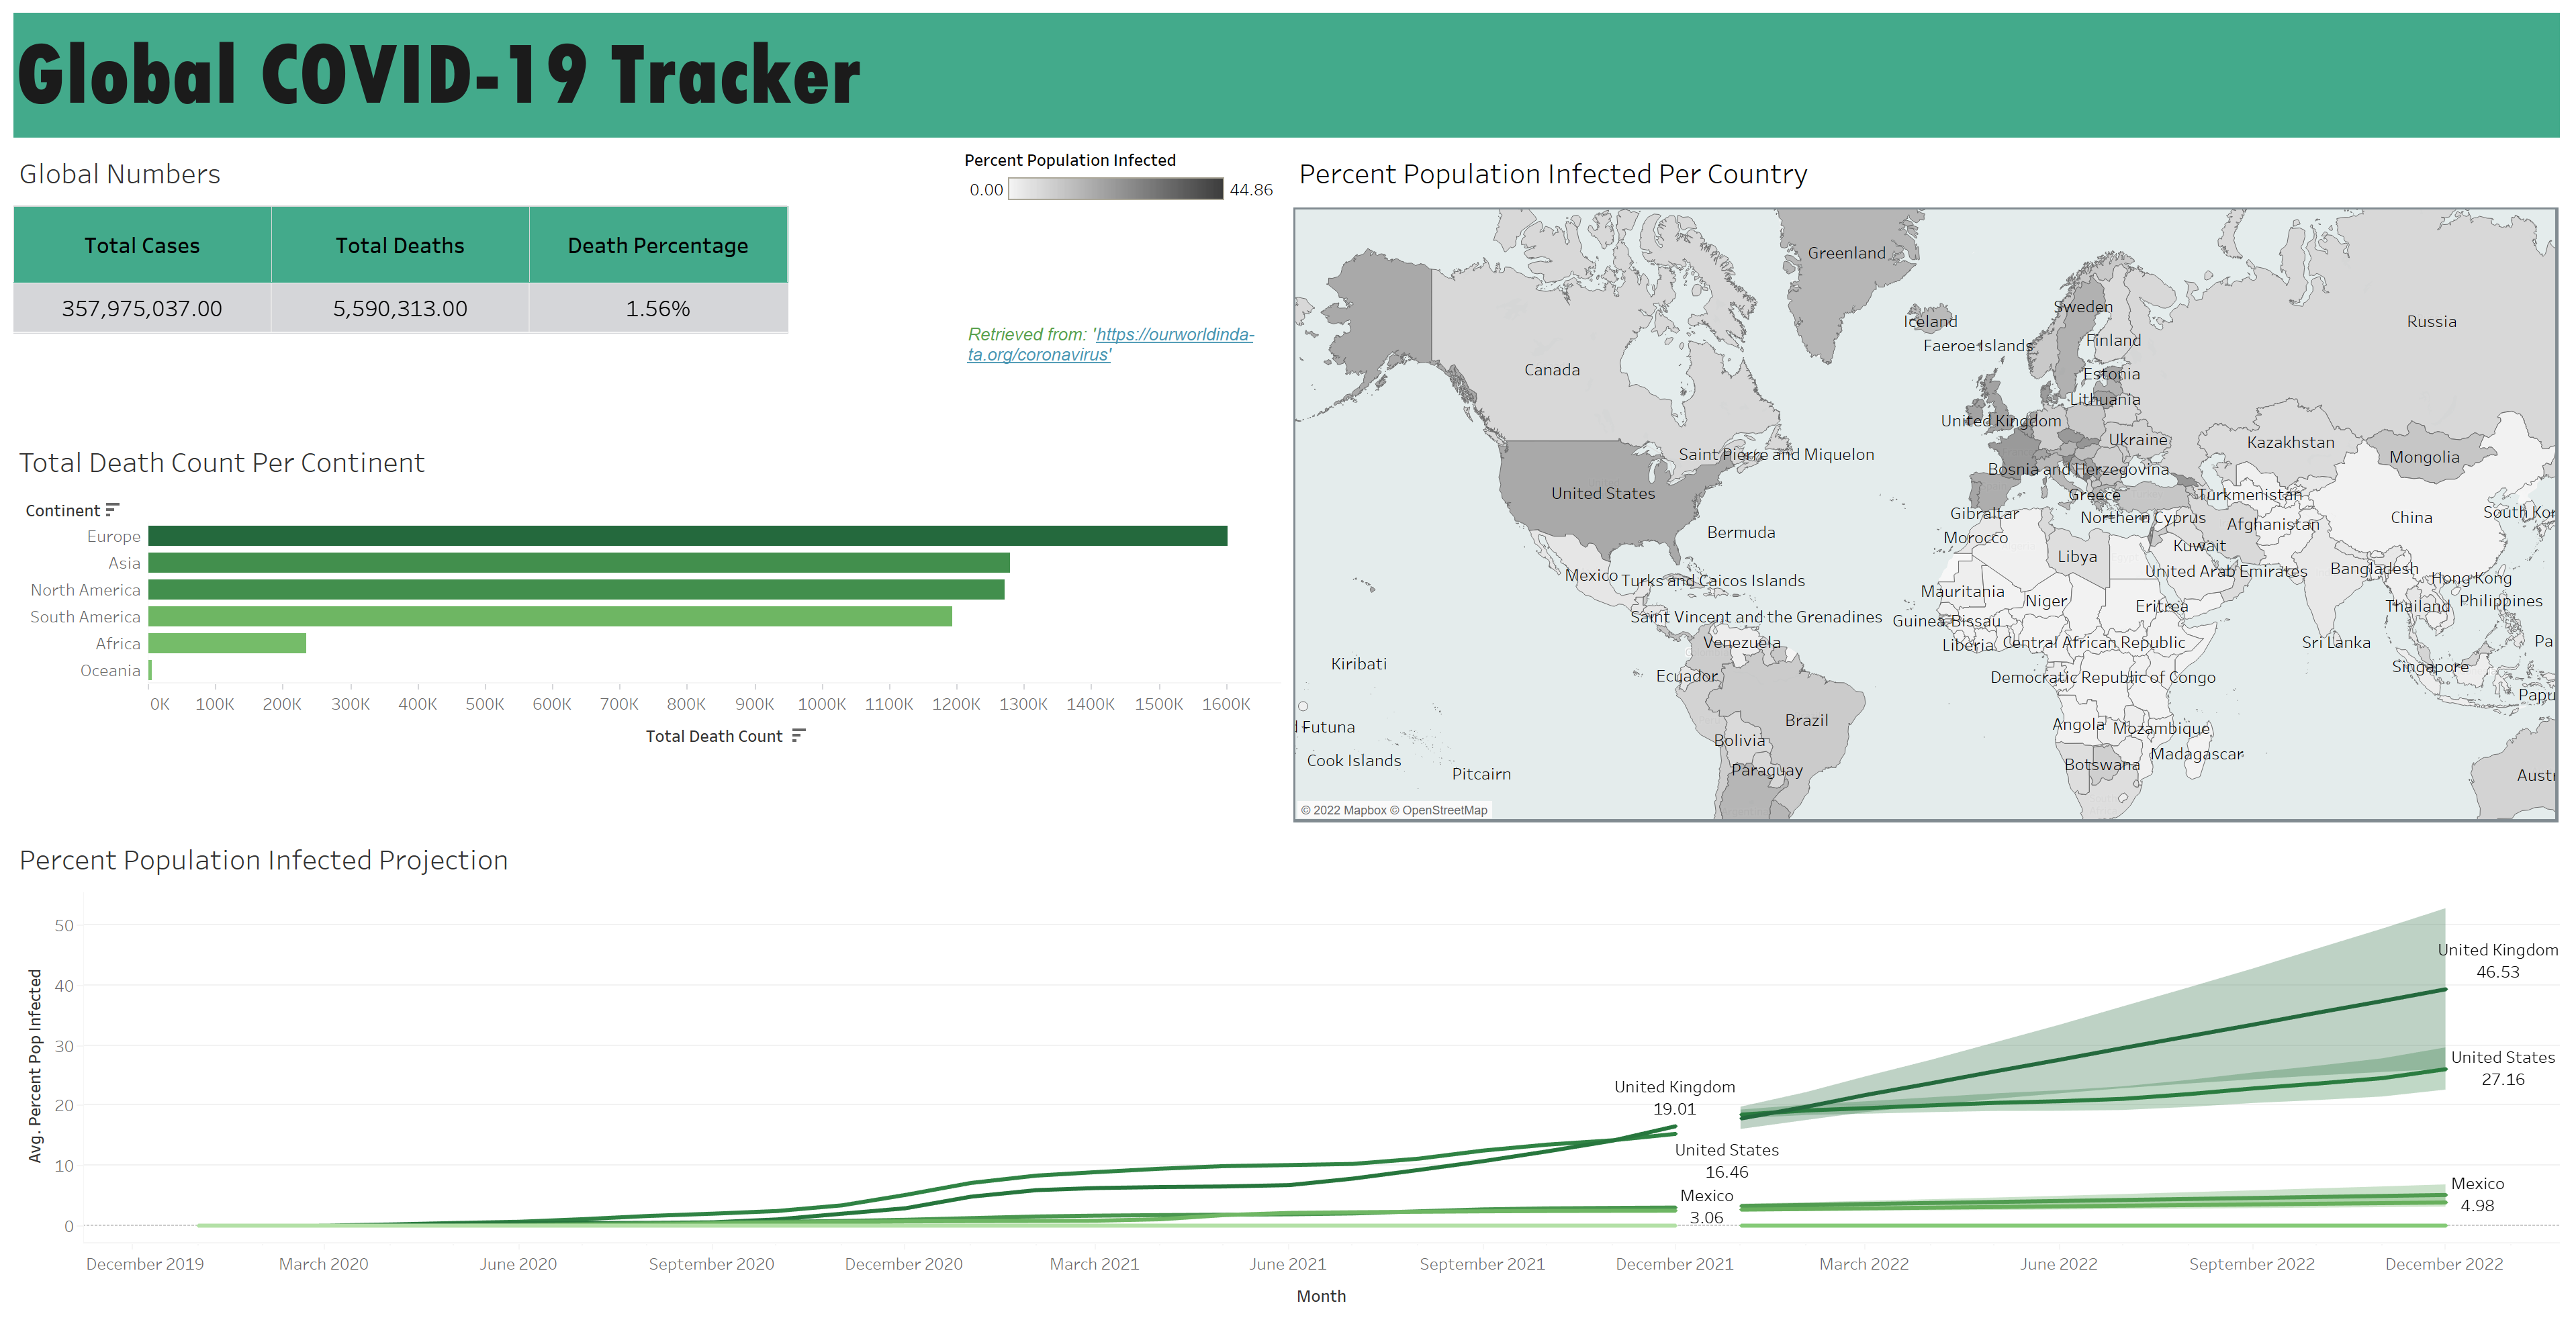
We utilized Tableau to develop a global COVID-19 tracker that showcases interesting insights discovered through our exploratory data analysis in SQL.

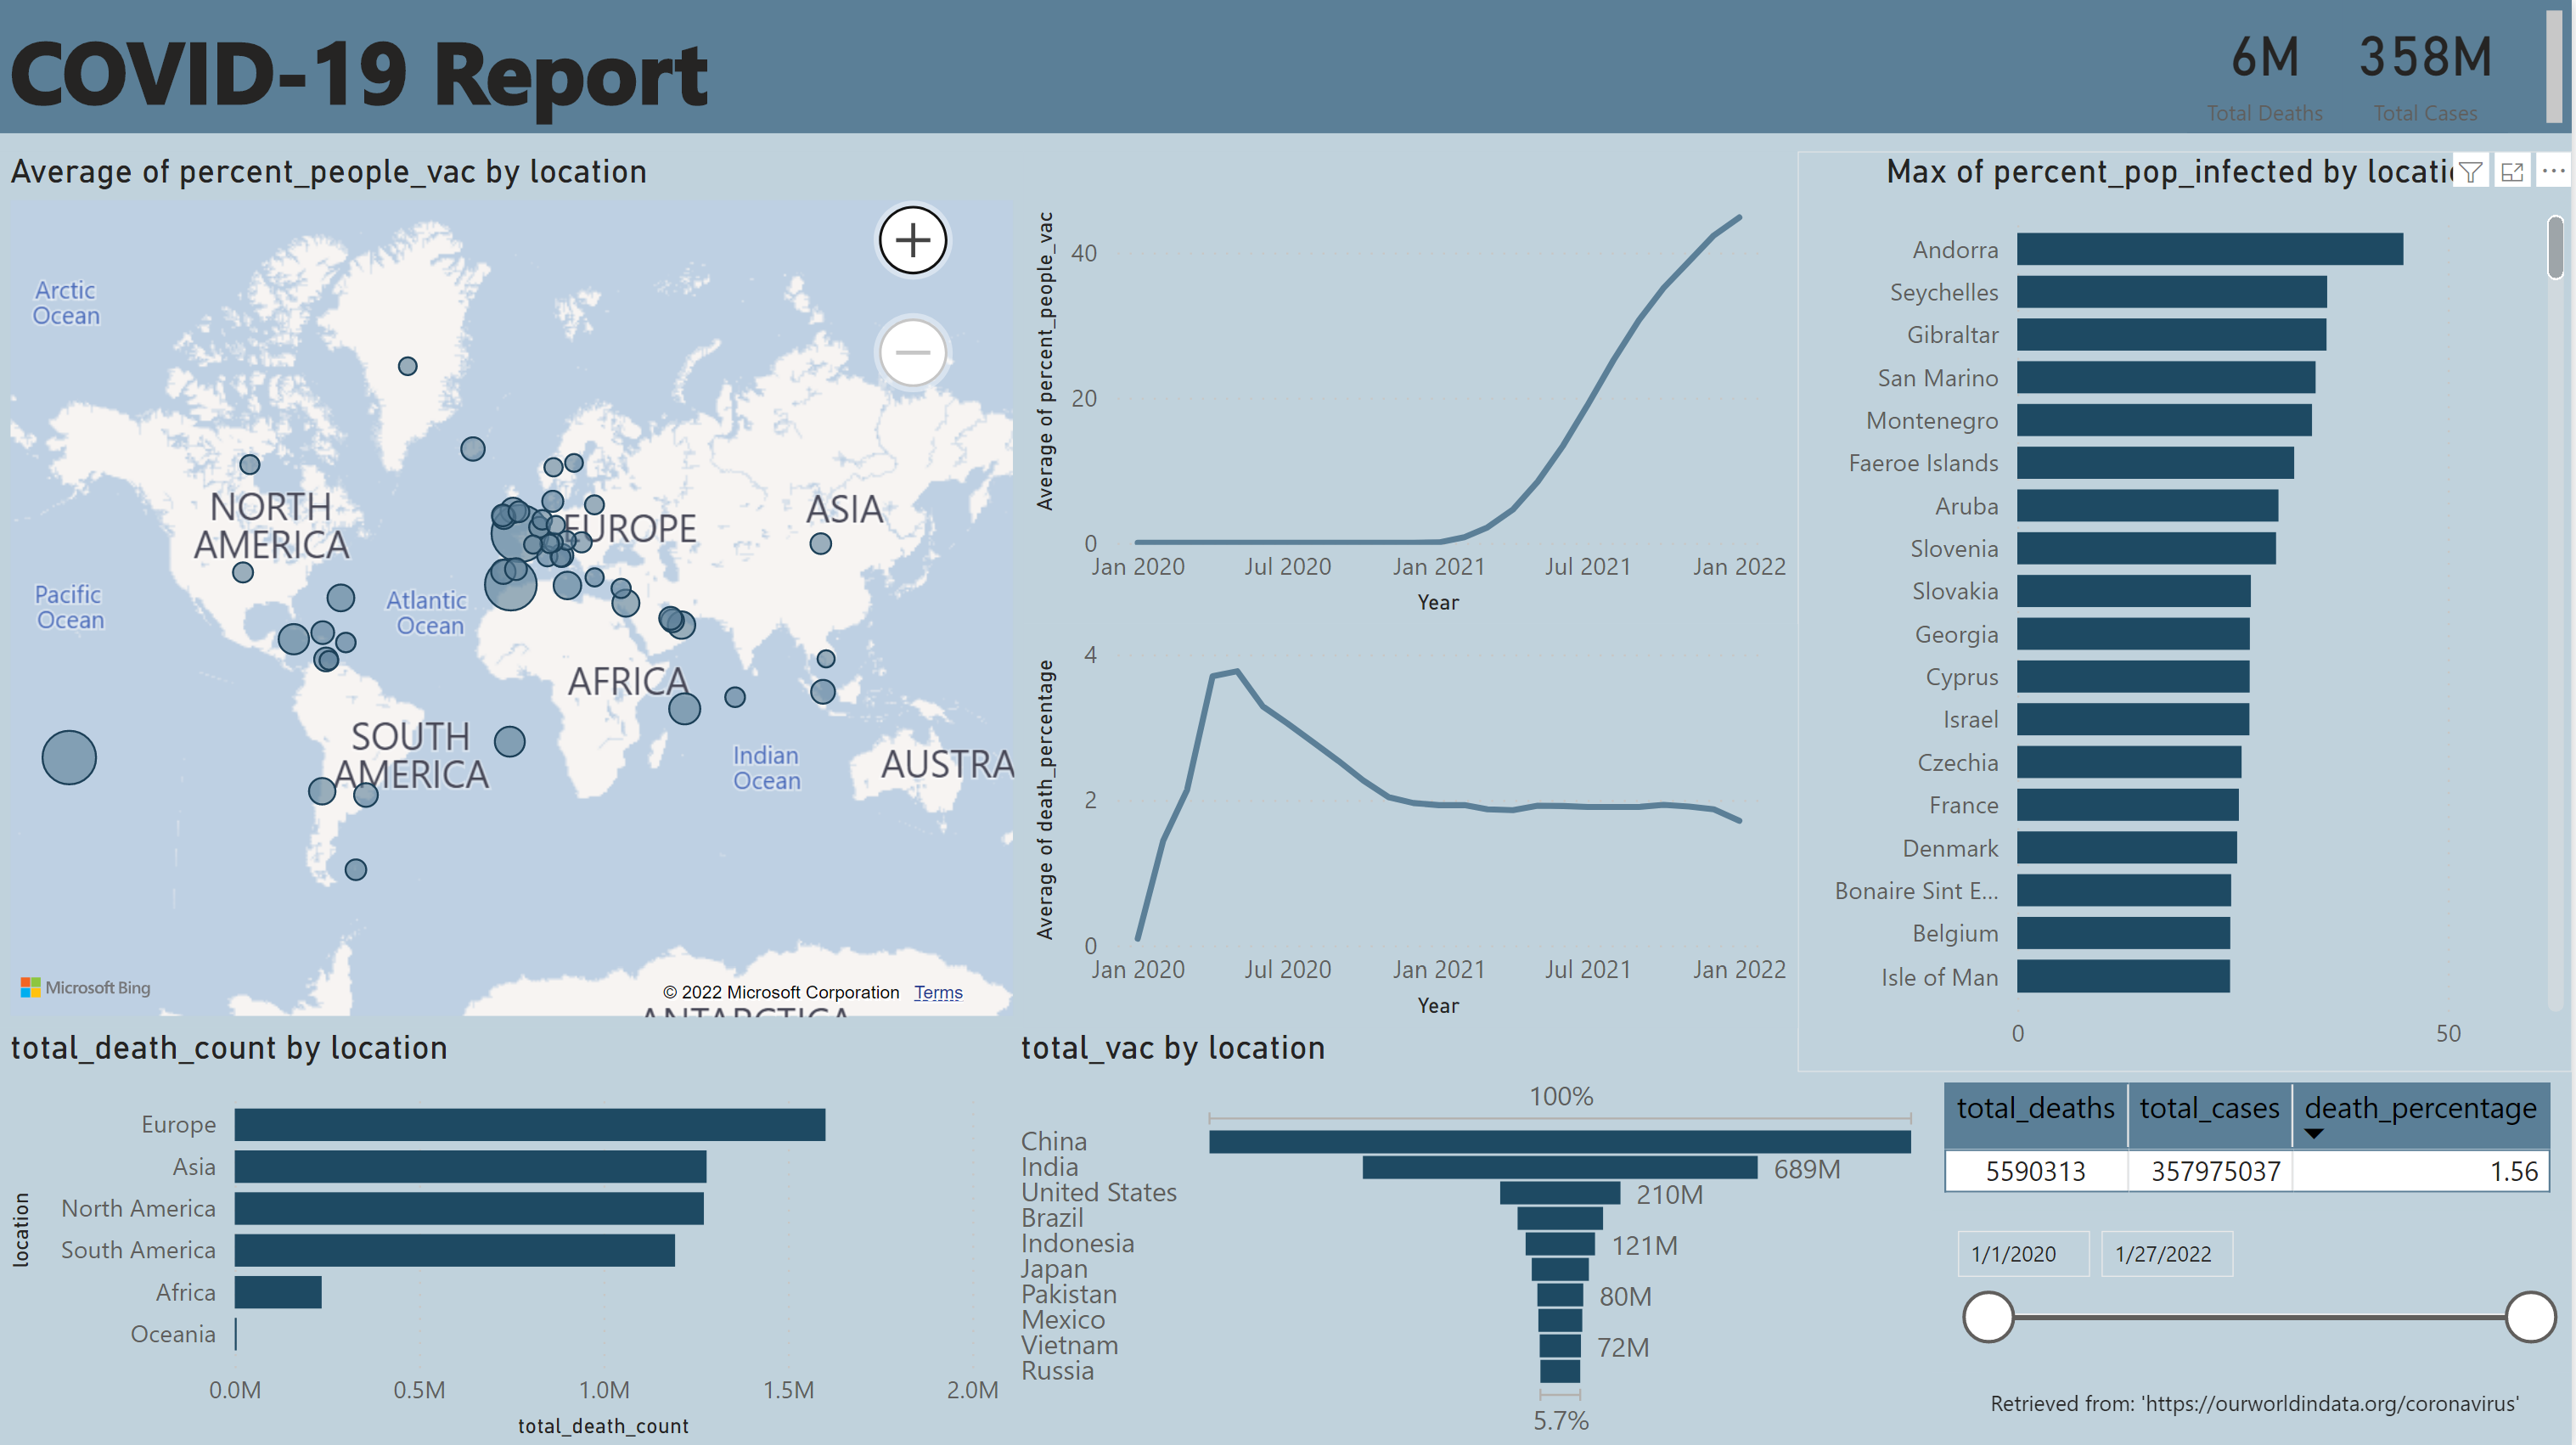
We delve deeper into the analysis of Covid-19 worldwide by creating a PowerBI report with interactive visualizations.
This project focuses on utilizing Scrapy to scrape laptop information from Backmarket, the leading marketplace for refurbished electronics.

In this project, we employ Pandas to clean and uncover patterns in price and product age of laptops from Backmarket through data analysis in a Deepnote notebook.

In this project, we examine the correlation between various factors and gross revenue in the movie industry, utilizing Python's correlation analysis capabilities.